

Configurações Eficazes do MACD para Day Trading
📊 Descubra as melhores configurações do MACD para day trading. Aprenda a ajustar o indicador, evitar sinais falsos e melhorar suas operações intradiárias!
Editado por
Fernanda Gomes
Moving averages are among the most trusted tools for day traders aiming to make quick, informed decisions. At their core, moving averages smooth out price data over a specific period, helping traders spot trends and avoid getting caught in the noise of daily price fluctuations.
There are mainly two types you'll encounter: the Simple Moving Average (SMA) and the Exponential Moving Average (EMA). The SMA calculates the average price over a set number of periods, giving equal weight to each. The EMA, however, favors recent prices more heavily, making it more responsive to the latest market moves—a critical factor when every minute counts in day trading.
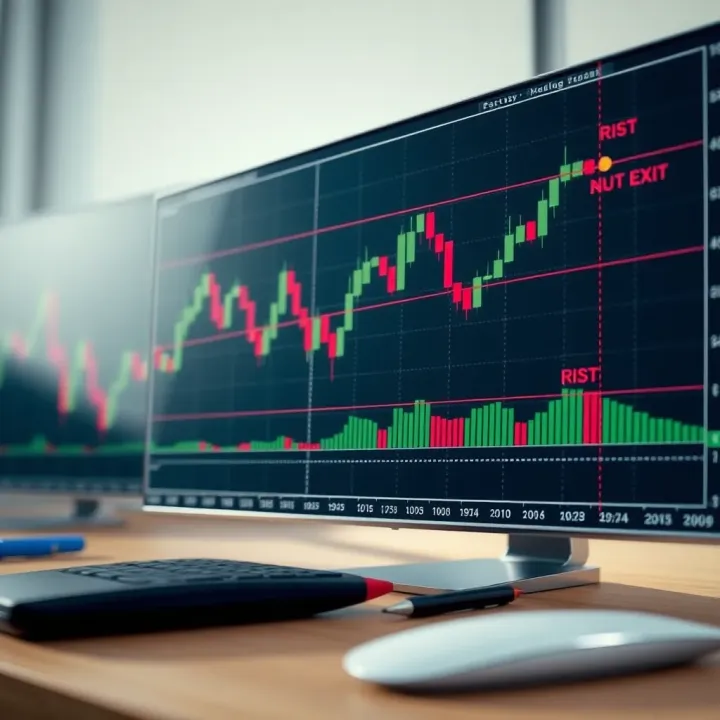
For example, a 20-period EMA on a 5-minute chart means the average price over the last 20 intervals is recalculated with more focus on recent trades, offering a realtime picture of momentum shifts.
Remember, no single indicator works perfectly. Using moving averages in tandem with other tools improves your chance of spotting entry and exit points.
Here are key ways moving averages play into your day trading strategy:
Trend Identification: When price trades above a moving average, it signals an uptrend; below signals a downtrend. Simple, but effective.
Crossovers: The classic “golden cross” (short-term average crosses above long-term) signals a potential buy, while the “death cross” suggests a sell. On short timeframes, these crossings can hint at quick shifts.
Support and Resistance: Moving averages often act like dynamic support or resistance lines. Prices may bounce off these averages, giving you clues about potential reversals or breakouts.
In practice, many day traders combine a 9 or 20 EMA with a longer 50 or 100 EMA to capture both short-term momentum and broader trend direction. For instance, when a 9 EMA crosses above the 50 EMA with rising volume, it could signal a strong buying opportunity.
Beyond identifying trades, moving averages help with risk management. They guide stop-loss placements just below a moving average support level on long positions or above resistance for shorts.
Moving averages aren’t crystal balls, but they offer a straightforward way to interpret price action. Mastering their signals and integrating them with volume, momentum indicators, or price action strategies will give you a solid edge in the fast-moving day trading environment.
Moving averages are among the most popular tools traders rely on to grasp market moves quickly. They help you cut through short-term noise by tracking the average price over a set period. For day traders, understanding how moving averages work and what they reveal about price trends is key to making smarter, faster trading decisions.
Moving averages smooth out price data by averaging out closing prices over a certain number of periods, whether minutes, hours, or days. This creates a clearer picture of where price is generally headed, rather than reacting to every tiny blip. For example, a 10-minute moving average will take the average price of the last 10 minutes, updating every new minute, softening sudden jumps or drops.
The main idea is to reduce random fluctuations so you can identify underlying trend direction and momentum. When prices bounce around a lot, moving averages provide a gentle curve instead of a jagged mess, helping you stay focused on the bigger picture.
Simple Moving Average (SMA) is the straightforward kind — it adds up prices for a set number of periods and divides by that number. For instance, a 20-period SMA sums up prices for 20 bars and averages them. It’s easy to compute and popular because it shows smooth trends clearly. But it's a bit slow to react to price changes since every period has equal weight.
Exponential Moving Average (EMA) gives more weight to recent prices, which makes it more responsive to new market information. Day traders often prefer EMAs since they can pick up trend shifts faster. Take a 9-period EMA: it reacts more quickly to price changes in the last 9 ticks than an SMA would, helping catch momentum moves sooner.
There are other variations like Weighted Moving Averages (WMA) or Hull Moving Averages (HMA), which fine-tune how much recent data matters. These can be handy if you want an even sharper or smoother trend line. Choosing the right type depends on your style — some like steadier signals, others prefer quick responses.
First and foremost, moving averages help identify trends. If the price stays above a chosen moving average, it often points to an uptrend; below it suggests a downtrend. This quick visual cue helps day traders decide whether to go long or short without second-guessing every little price wiggle.
They also act as support and resistance levels. Prices often bounce off moving averages during trending moves. For example, a stock might pull back to its 20-period EMA and then pop higher, creating a clear spot to enter a trade. Spotting these bounce points gives you a natural place to set stop-loss orders too.
Finally, moving averages generate signals for entries and exits. Crossovers, like when a short-term moving average crosses above a longer one, often indicate a new buying opportunity. Conversely, price crossing below a moving average might signal a time to exit or short. These signals can help day traders time trades more effectively without relying on guesswork.
Remember, no single tool works perfectly alone. Moving averages give you a solid foundation, but combining them with other indicators and a good risk plan improves your edge in fast markets.
Understanding moving averages lays the groundwork for using them to spot trends, set trade levels, and improve your day trading strategies from the ground up.
Using moving averages effectively in day trading boils down to choosing the right settings and combining techniques that fit the fast-moving market’s rhythm. By tailoring moving averages to short-term price action, traders can identify quicker shifts in trends and make more timely entries and exits. But it isn't just about plugging in numbers; understanding how to balance responsiveness with reliability matters just as much.
For day traders, short-term moving averages typically range from 5 to 20 periods. For example, a 9-period Moving Average is popular for capturing near-immediate price changes during active market hours. These shorter periods react quickly to price swings, offering timely signals ideal for intraday trading.
However, excessively short periods can lead to noisy data, triggering frequent false signals. That’s where balancing sensitivity and reliability comes in. You want your moving average to be responsive enough to catch trends early but stable enough to avoid whipsaws. For instance, pairing a 9-period EMA (Exponential Moving Average) with a 21-period EMA can give you a more reliable reading by smoothing out abrupt price moves without losing the edge on quick trends.
Moving average crossovers are a classic tool where a short-term MA crosses above or below a longer-term MA, signaling potential trend shifts. Imagine the 10-period crosses above the 30-period average; that often sparks a buy signal. Crossovers help traders spot momentum changes fast, but they need confirmation to avoid entering on false alarms.
Price and moving average interactions are equally valuable. When price repeatedly bounces off the moving average, it can act as dynamic support or resistance. In some instances, a price crossing above the MA suggests strength, while dropping below might warn of weakness. Monitoring these points can help traders anticipate pullbacks or trend continuation.
Using moving averages in breakout and pullback setups is another practical approach. For example, a stock breaking above its 20-period moving average on good volume often signals a fresh move higher. Conversely, during pullbacks, price retesting and holding the MA can provide low-risk entry points within an ongoing trend.
Dual moving average strategies use two averages of different periods, such as the 5-period and 20-period MA, to filter trades. When the shorter MA stays above the longer one, it confirms an uptrend, and vice versa. This technique reduces guesswork and provides clearer entry and exit cues.
Triple moving average setups bring an added filter by including an intermediate period, like 5-, 13-, and 34-period MAs. Traders look for alignment across all three to confirm a strong trend, only trading in the direction where short-term MA is above intermediate, which is above long-term MA (or the reverse for downtrends). This reduces noise but might slow signals slightly.
Avoiding false signals is crucial since MAs lag price and can mislead during choppy, sideways markets. Combining moving averages with other indicators, such as volume or momentum oscillators, helps validate signals. Also, setting minimum distance criteria between MAs before acting or waiting for price confirmation can prevent entering on weak or fake moves.
"Using moving averages strategically—rather than blindly following every crossover—helps day traders cut through noise and spot genuine trading opportunities timely."
Managing risks is a cornerstone of successful day trading, especially when using moving averages as a tool. While moving averages can help you spot trends and time entries, they’re not foolproof. Understanding their limitations and learning to set proper stop losses and take profits will protect your capital and improve your trade outcomes.
Moving averages rely on past price data to create smoothed lines, which means their signals lag behind real-time price action. For example, if a 20-period moving average indicates an uptrend, the price may have already moved significantly before the signal actually appears. This delay can cause you to enter trades late or exit too slowly, potentially reducing profits or increasing losses. Recognizing this lag helps you combine moving averages with other tools or price action to confirm signals before making decisions.
Moving averages work best when prices exhibit clear trends. In sideways or choppy markets, prices frequently cross moving averages without establishing strong direction, resulting in false signals. For instance, a 15-minute chart might show price oscillating around its moving average multiple times within a short window, triggering multiple buy and sell signals that fail to capture sustained moves. Traders using moving averages in these conditions risk getting whipsawed—entering and exiting trades repeatedly with little gain and high transaction costs. It’s crucial to identify when markets are ranging and possibly stay on the sidelines or use additional indicators to avoid false setups.
Moving averages can serve as dynamic support or resistance levels, making them practical for placing stop losses. Suppose you enter a long trade after price breaks above a 10-period moving average on a five-minute chart. Placing your stop just below the moving average line gives your trade some breathing room while defining a clear exit point if the trend reverses. This approach ties your risk management directly to the indicator driving your trade, maintaining coherence in your strategy.
Markets don’t stay static, so your profit targets and stops need flexibility. If a moving average starts to flatten or the price shows signs of fading momentum, you might tighten your stops or lock in partial profits to protect gains. For example, in a fast-moving stock, you could trail your stop using a short-term moving average, letting it rise steadily and triggering your exit if the price dips below it. This tactic adapts to shifting conditions, prevents giving back profits, and helps maintain disciplined exits aligned with your moving average signals.
The bottom line is that managing risks with moving averages involves knowing their limits and using them smartly to set stops and targets that match the market's rhythm.
In short, no indicator guarantees success, but understanding how to manage moving average signals—and the risks they bring—puts you ahead in the game.
Moving averages are a solid foundation for day trading, but pairing them with other tools can really sharpen your edge. By adding volume analysis and other technical indicators, you gain a clearer picture of market momentum and potential turning points. This layered approach helps cut through noise, minimizes false signals, and provides stronger confirmation for your trading decisions.
Volume acts like the heartbeat behind price moves. When the price crosses or holds above a moving average, checking volume tells you if there’s real conviction. For example, if a stock breaks above its 20-period EMA on heavy volume, that suggests genuine buying interest. On the flip side, if volume stays low during a breakout, the move might fizzle out quickly. Incorporating volume helps separate strong trends from weak, potentially misleading price moves.
Unexpected spikes or drops in volume can also hint at an impending reversal. Imagine a stock trending higher with steady volume, then suddenly volume surges while the price hits resistance near a moving average. This signals traders could be taking profits or tightening stops, and a pullback might be around the corner. Watching the interplay of volume and moving averages enables you to catch these turning points before they become obvious in price alone.
RSI measures whether an asset is overbought or oversold. When combined with moving averages, RSI can confirm entry and exit points. For instance, if the price dips below a short-term moving average but RSI indicates oversold conditions (below 30), it might suggest a buying opportunity. Conversely, if price crosses above a moving average but RSI is overbought (above 70), caution may be warranted. This combination helps you avoid chasing exhausted moves.
Bollinger Bands create a dynamic range around price, reflecting volatility. Using moving averages alongside these bands can give a more nuanced read on potential breakouts or retracements. For example, if the price touches the lower Bollinger Band and sits near a moving average, it might indicate strong support. A squeeze in the bands coupled with a moving average crossover often signals an upcoming volatility expansion, alerting traders to prepare for a possible breakout.
MACD blends moving averages to highlight momentum changes and potential trend shifts. Pairing this indicator with price moving averages can reinforce trade setups. When MACD lines cross while the price also crosses a moving average, it’s often a stronger signal than either alone. For example, a bullish MACD crossover alongside a breakout above the 50-period SMA can offer solid confirmation to enter a long position. MACD also helps manage risk by flagging weakening momentum.
Bottom line: enriching moving average strategies with volume data and complementary indicators adds confidence to your trades and reduces risk. This multi-tool approach gives you a fuller view of market dynamics and better timing for entries and exits.
📊 Descubra as melhores configurações do MACD para day trading. Aprenda a ajustar o indicador, evitar sinais falsos e melhorar suas operações intradiárias!

📊 Conheça a OlimpTrader: análise completa da plataforma, ativos, contas, estratégias, segurança e riscos para decidir seu investimento com confiança.

🔍 Explore a plataforma Quoex: conheça vantagens, desvantagens, tipos de ativos e métodos de depósito e retirada para operar seguro e informado!

📊 Descubra tudo sobre plataformas de trading online: recursos, tipos, segurança, custos e dicas essenciais para investir com confiança na internet! 🚀
Baseado em 8 avaliações